Hurricane Omar Forecast Verification
Written by Derek Ortt on April 5, 2009
Track forecasts for Hurricane Omar had larger than usual errors. The top panel in Figure 1 shows the errors. There were two main source for this. The first was a slowdown that occurred in the eastern Caribbean. Initially, Omar was expected to move to the NW and recurve to the NE. Instead, it stalled before moving to the NE. This resulted in a track well to the east of the forecast track. The second was not anticipating the acceleration after exiting the Caribbean. Figure 2, which shows the second Omar track forecast along with the best track, illustrates how both of these issues contributed to the large forecast errors. Despite the larger errors, it should be noted that the 96 hour error was merely 30 percent of the mean CLIPER error. This indicates that despite having an error of 409NM, the forecasts were very skillful and that Omar was a difficult storm to forecast.
Intensity forecasts were also a challenge. The rapid intensification into a category 4 hurricane was not expected. The intensification was very late in being recognized. In fact, the initial intensity error for forecast 3 was 20KT. However, had the been expected, the error may have been greater since it only was at cat 4 intensity at 0600 UTC October 16. This time is between forecast verification times. At the adjacent times, Omar was a category 2. The rapid weakening after exiting the Caribbean also was not anticipated.
A statement indicating that Hurricane conditions were possible was first inserted into the updates on Oct 14 at 2200 UTC. This was changed to expected for the Virgin Islands at 0900 UTC the next morning. This was less than the desired 24 hour lead time, due to the unexpected increase in motion. The updates did not state hurricane conditions were expected for the Leeward Islands until 1500 UTC, only about 18 hours prior to the closest approach.
For official information, and official watches and warnings, please see the National Hurricane Center Tropical Cyclone Report
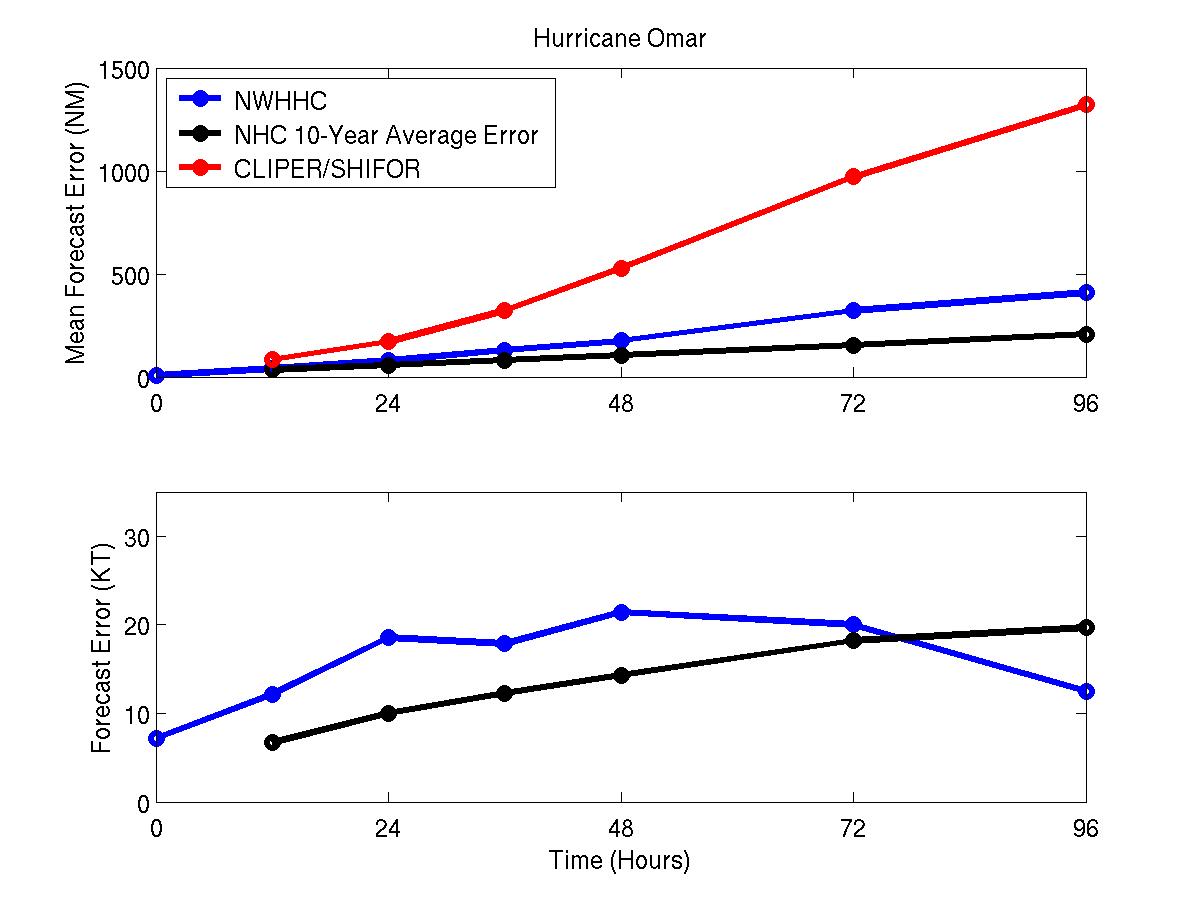
Figure 1: Mean track and intensity errors for Hurricane Omar. Blue represents NWHHC error, black the 10-year NHC mean, and red CLIPER/SHIFOR>
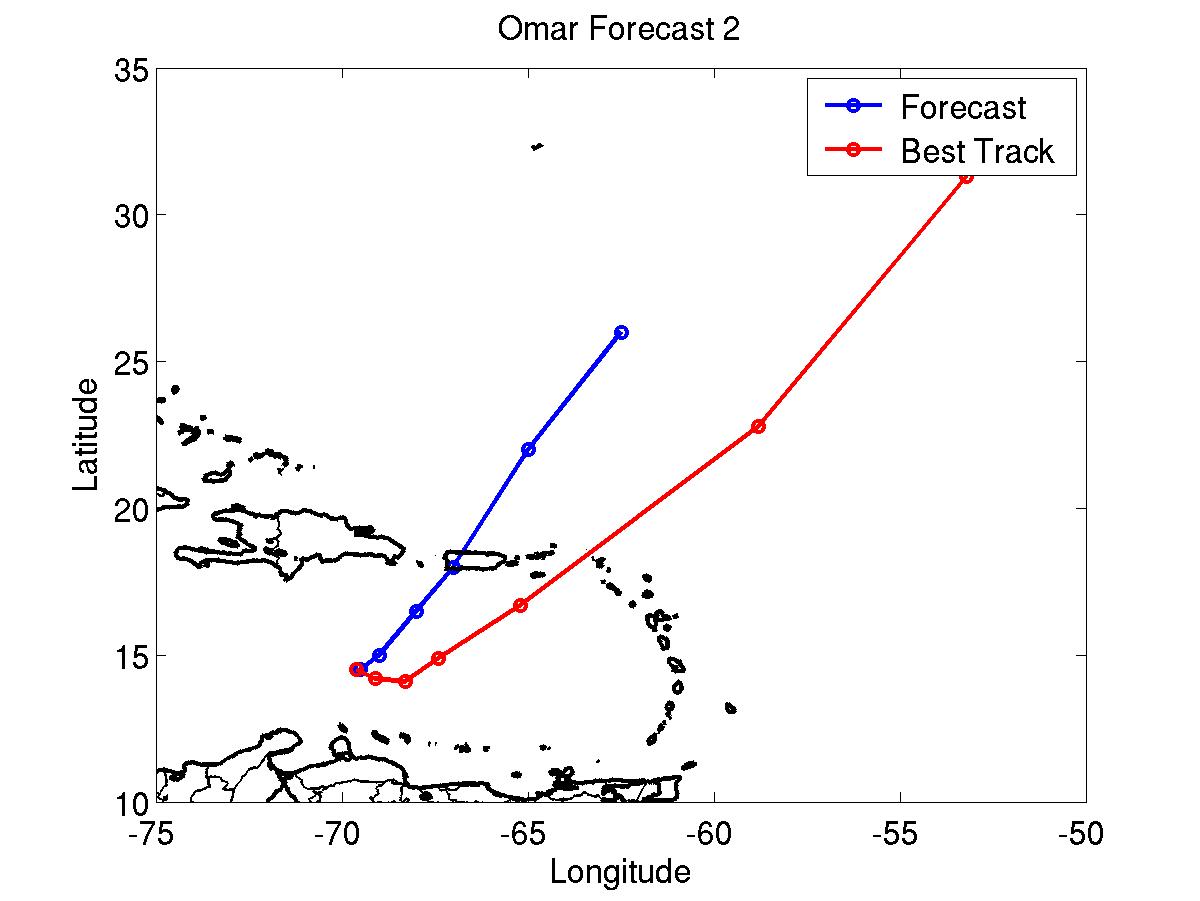
Figure 2: Omar track forecast #2. Blue represents NWHHC forecast, red the best track.
Times when tropical storm/hurricane condition states included in updates
10/14 2200: Hurricane conditions possible: Puerto Rico, Virgin Islands, Leeward Islands north of Antigua
10/15 0900: Hurricane conditions expected: Virgin Islands
10/15 0900: Hurricane conditions possible/Tropical storm conditions expected: Puerto Rico, Leeward Islands north of Antigua
10/15 1500: Hurricane conditions expected: Leeward Islands north of Antigua
10/15 1500: Hurricane conditions possible/tropical storm conditions expected: Antigua
10/16 0000: Hurricane conditions no longer possible" Puerto Rico
10/16 0300: Tropical storm conditions no longer expected: Puerto Rico
10/16 1200: Hurricane and tropical storm conditions no longer expected or possible: All
Click Here for individual track/intensity verification statistics.
Back to verification index