2005 ATLANTIC HURRICANE SEASON FORECAST VERIFICATION
Written by Derek Ortt on August 11, 2005
Verification statistics are available for all Atlantic Ocean tropical cyclones that reached tropical storm intensity, or higher. Verification statistics include the tropical depression phase; however, verification statistics are not calculated for the extra-tropical phase, nor are they calculated for a system's position if the system degenerates into a tropical wave. If a system degenerates, but then regenerates back into a tropical cyclone, verification statistics are calculated for the time periods after the cyclone reforms.
As is the accepted scientific practice, these forecasts are verified primarily against the CLIPER model for track, and the SHIFOR model for intensity. Comparisons with these models provide the amount of skill that the forecasts have. In addition, comparisons with the NHC 10-year average (3-year average for 96 and 120 hour forecast times) have also been made to determine how accurate the forecasts are relative to the long-term trends.
Track and intensity forecast verification statistics will be included in a table following this section. The track forecasts were significantly better than the CLIPER model, indicating that there was significant skill involved in these forecasts. However, the absolute track errors were greater than those of last year. In addition, for the 12-96 hour time periods, the errors were comparable to or slightly greater than the NHC 10-year average (4 year average for 96 hour forecasts). The errors at the 120 hour time period were slightly below the long-term mean. Intensity forecast errors were below those of SHIFOR, indicating that the intensity forecasts had skill. However, they too were above those of last season and were above the long-term mean. Some of the larger intensity errors could be related to the occurrences of rapid intensity change, such as what occurred with Hurricanes Dennis, Katrina, Rita, and Wilma.
It should be noted that while these forecasts verified very well, they are still subject to error, especially at the 96 and 120 hour time periods. Users need to remember two very important things. The first is that anyone within the 10-year mean error is at risk for a direct hit of the cyclone. The second is that a tropical cyclone is not a point. A clear example of this is Hurricane Katrina, which was forecast to make landfall near or just east of New Orleans, Louisiana. This forecast verified. However, the hurricane force winds and devastating storm surge extended as far east as Mobile Alabama, with severe impacts extending to the Florida Panhandle.
Please see the storm verification reports for the forecast errors for the individual storms.
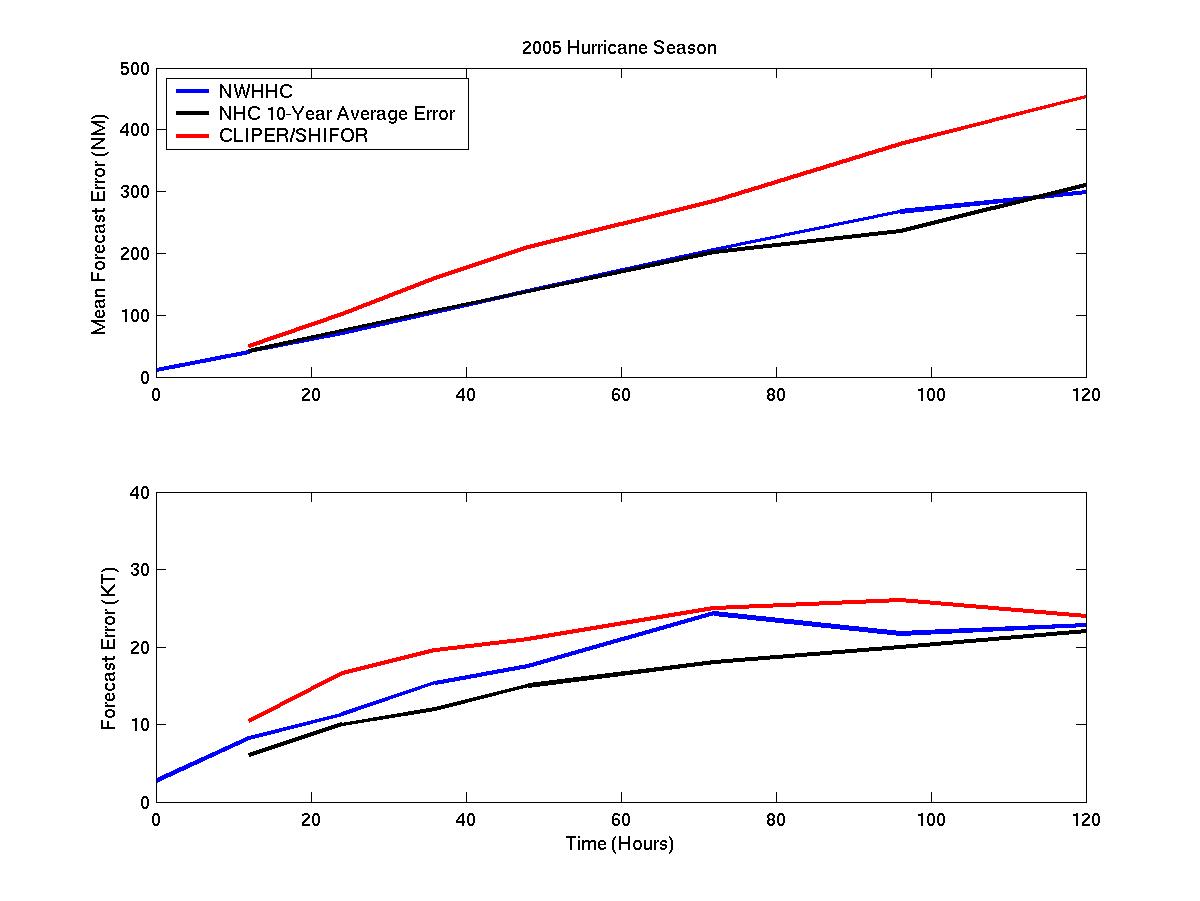
Seasonal mean track and intensity forecast errors
TABLE OF TRACK VERIFICATION STATISTICS
Format is of NWHHC Forecasts, NHC 10-year average, CLIPER Forecasts. All in NM
Number of cases in parenthesis
12 Hour (212): 40.6 42 49
24 Hour (207): 71.2 75 102
36 Hour (196): 105.2 107 160
48 Hour (180): 139.0 138 210
72 Hour (146): 205.9 202 285
96 Hour (114): 267.6 236 377
120 Hour (88): 298.6 310 453
TABLE OF INTENSITY VERIFICATION STATISTICS
Format is same as for track, except CLIPER is replaced by SHIFOR
Number of cases remains the same
12 Hour: 8.2 6 10.4
24 Hour: 11.3 10 16.6
36 Hour: 15.4 12 19.6
48 Hour: 17.5 15 21.0
72 Hour: 24.3 18 25.0
96 Hour: 21.7 20 26.0
120 Hour: 22.8 22 24.0
Back to main verification page