2004 ATLANTIC HURRICANE SEASON FORECAST VERIFICATION
Written by Derek Ortt on June 5, 2005
Verification statistics are available for all Atlantic Ocean tropical cyclones that reached tropical storm intensity, or higher. Verification statistics include the tropical depression phase; however, verification statistics are not calculated for the extra-tropical phase, nor are they calculated for a system's position if the system degenerates into a tropical wave. If a system degenerates, but then regenerates back into a tropical cyclone, verification statistics are calculated for the time periods after the cyclone reforms.
As is the accepted scientific practice, these forecasts are verified primarily against the CLIPER model for track, and the SHIFOR model for intensity. Comparisons with these models provide the amount of skill that the forecasts have. In addition, comparisons with the NHC 10-year average (3-year average for 96 and 120 hour forecast times) have also been made to determine how accurate the forecasts are relative to the long-term trends.
Track and intensity forecast verification statistics will be included in a table following this section. The track forecasts were significantly better than the CLIPER model, indicating that there was significant skill involved in these forecasts. These statistics were also much better than the NHC 10-year average. It should be noted, however, that these forecasts are only issued every 12 hours, except in the event of a category two or higher hurricane threatening the United States, in which time the forecasts are issued every 6 hours, while the CLIPER and long-term statistics are based off of forecasts issued every 6 hours. Intensity forecasts, on the other hand, were less skillful. While they bettered the errors produced by the SHIFOR model, the errors, especially for the 12 and 24 hour time periods, were worse than those of the 10-year average. The short-term intensity errors may have been enhanced by poorly forecasting the timing of eye wall replacement cycles. These processes are extremely difficult to forecast with any level of accuracy. It has not yet been decided whether or not fluctuations in intensity will be depicted in the forecasts for the upcoming hurricane season.
It should be noted that while these forecasts verified very well, they are still subject to error, especially at the 96 and 120 hour time periods. Users need to remember two very important things. The first is that anyone within the 10-year mean error is at risk for a direct hit of the cyclone. The second is that a tropical cyclone is not a point. A clear example of this is Hurricane Ivan, which was forecast to make landfall near or just east of Mobile, Alabama. This forecast verified. However, the hurricane force winds and devastating storm surge extended as far east as Panama City, Florida, with Pensacola, Florida, located about 40 miles east of where the eye made landfall, receiving some of the worst impacts.
Please see the storm verification reports for the forecast errors for the individual storms.
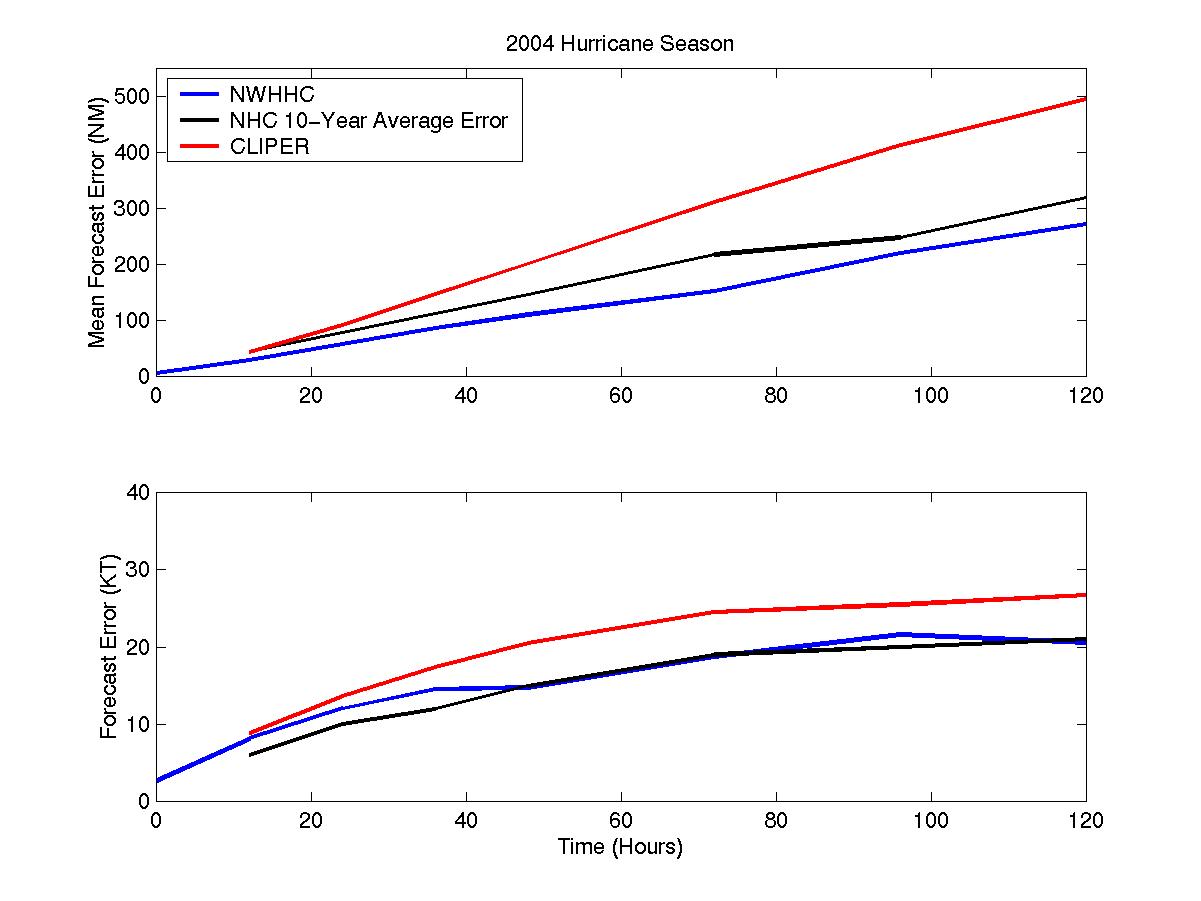
Seasonal mean track and intensity forecast errors
TABLE OF TRACK VERIFICATION STATISTICS
Format is of NWHHC Forecasts, NHC 10-year average, CLIPER Forecasts. All in NM
Number of cases in parenthesis
12 Hour (145): 30.2 44 43
24 Hour (140): 57.3 78 91
36 Hour (131): 86.5 112 146
48 Hour (122): 110.1 146 201
72 Hour (104): 152.7 217 311
96 Hour (86): 220.4 248 413
120 Hour (72): 271.4 319 495
TABLE OF INTENSITY VERIFICATION STATISTICS
Format is same as for track, except CLIPER is replaced by SHIFOR
Number of cases remains the same
12 Hour: 8.1 6 8.8
24 Hour: 12.0 10 13.6
36 Hour: 14.5 12 17.5
48 Hour: 14.7 15 20.3
72 Hour: 18.8 19 24.5
96 Hour: 21.6 20 25.5
120 Hour: 20.6 21 26.7
Back to main verification page